
Introduction
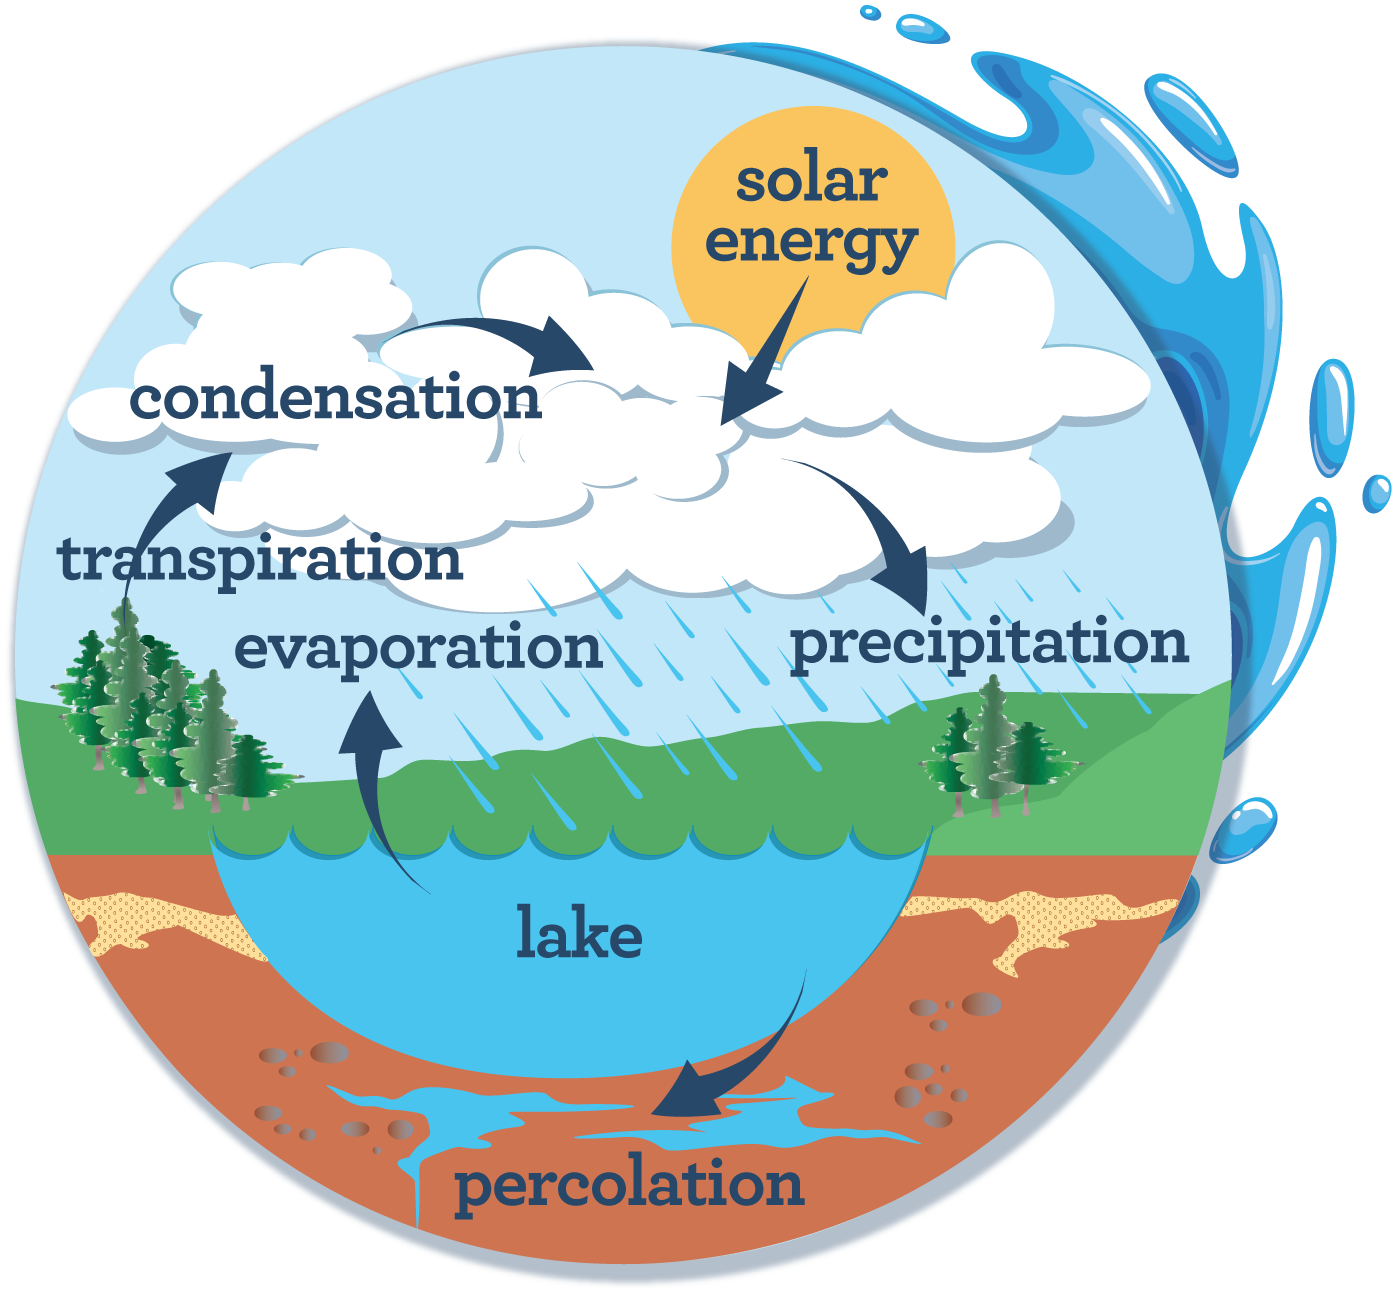
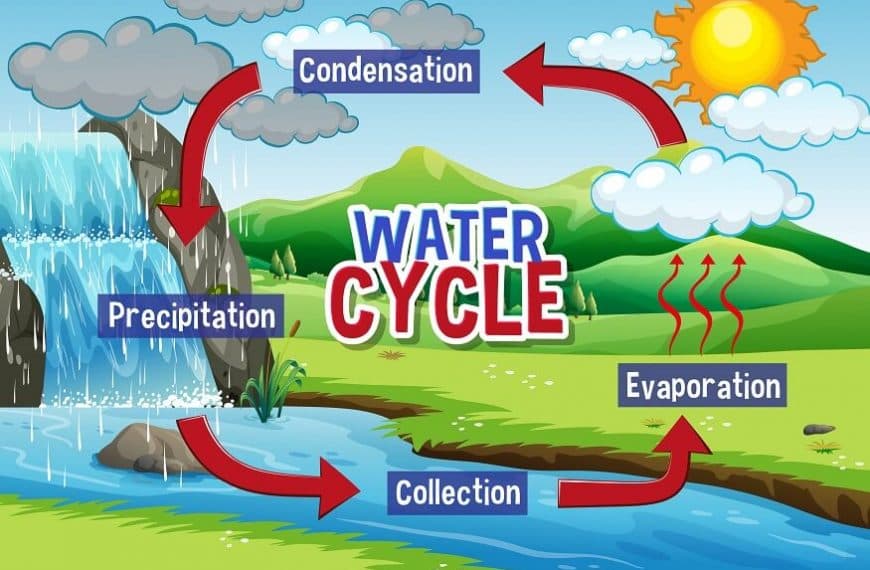
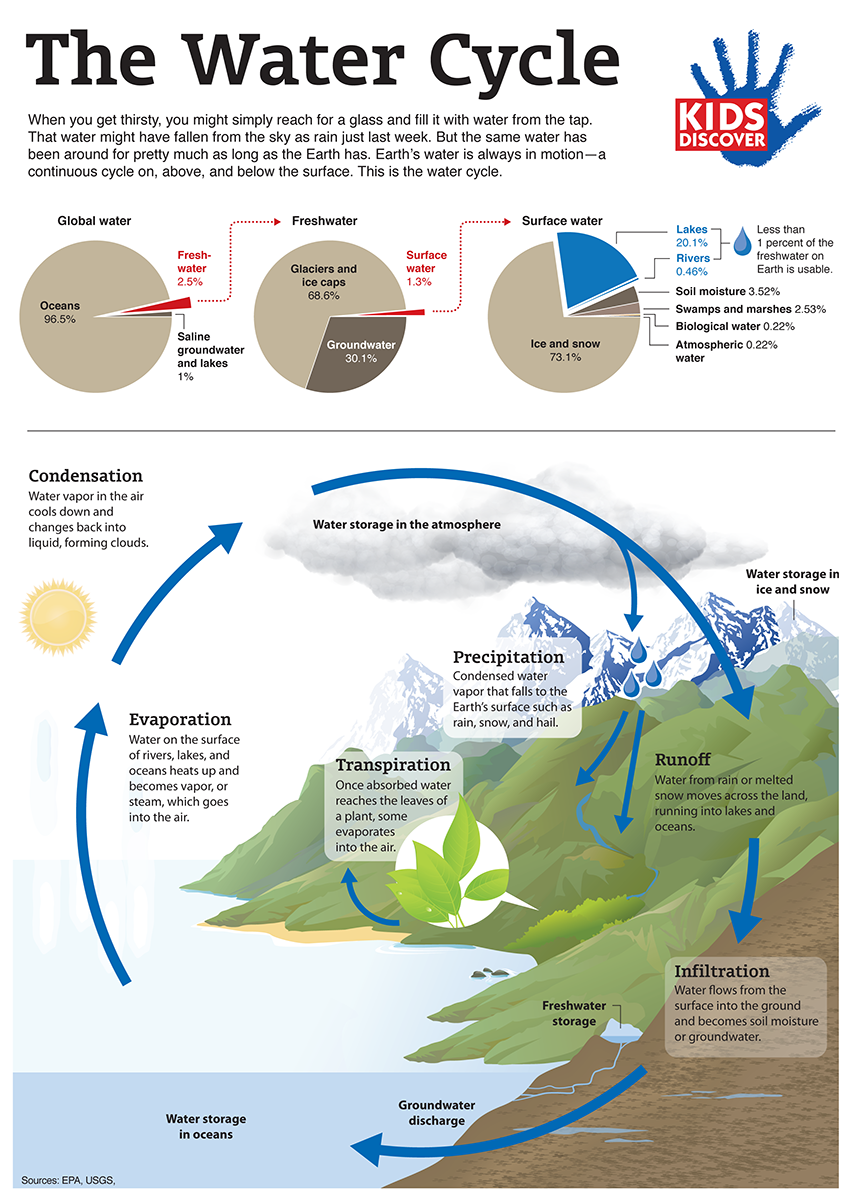
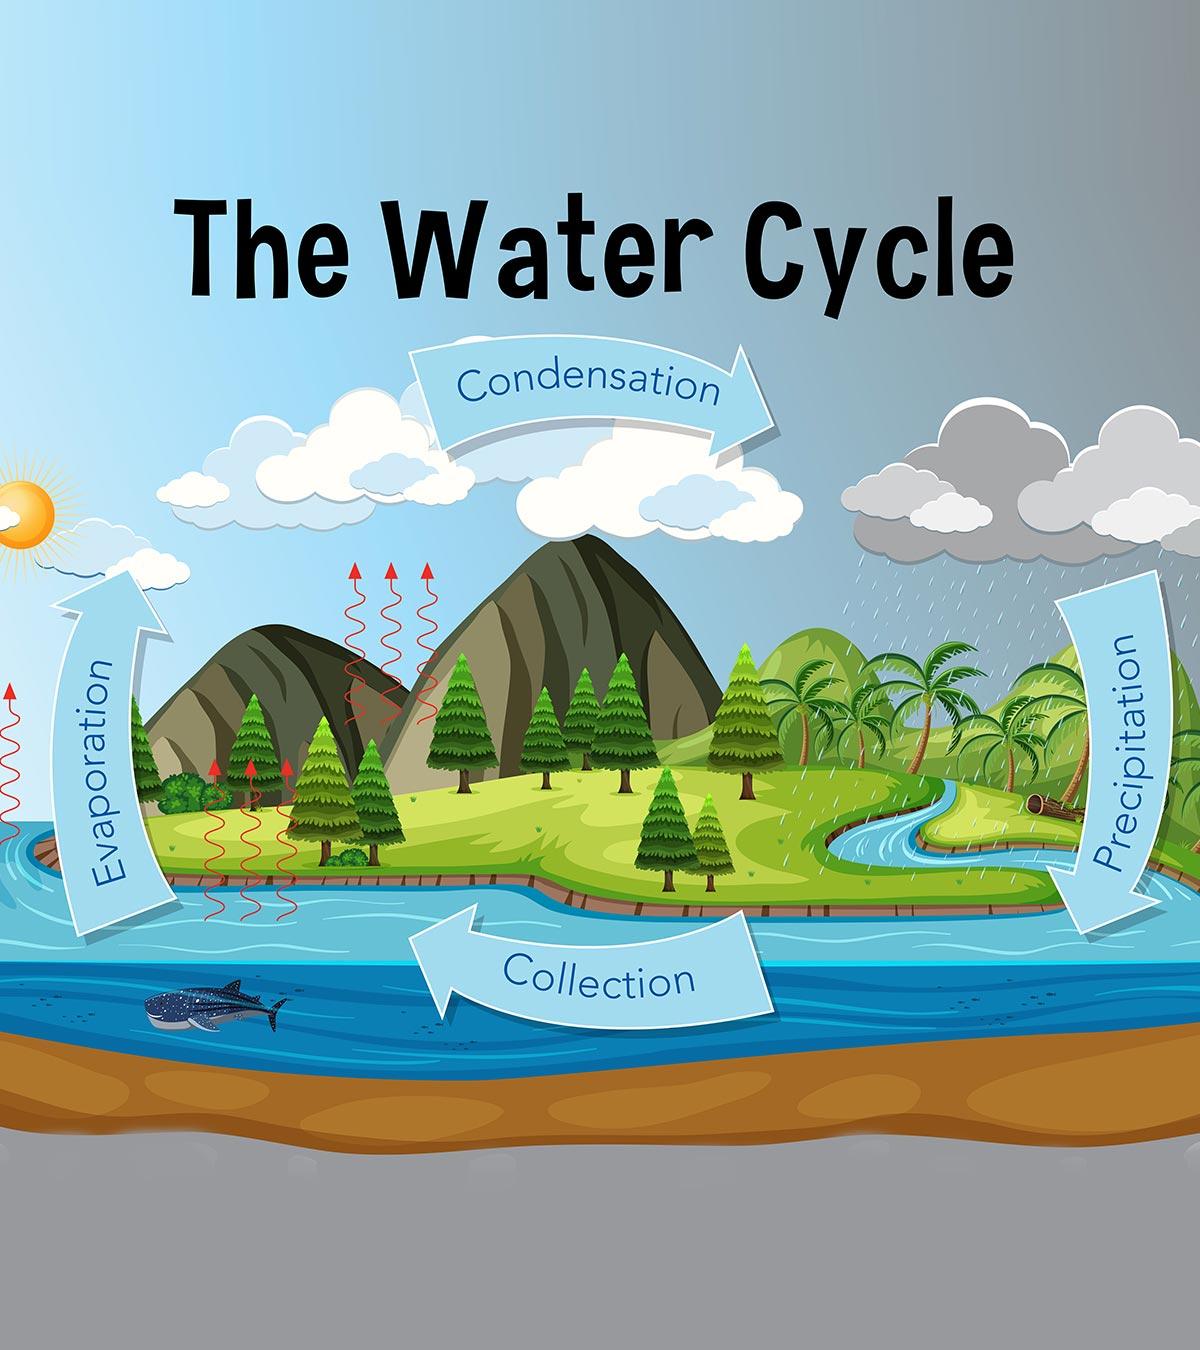
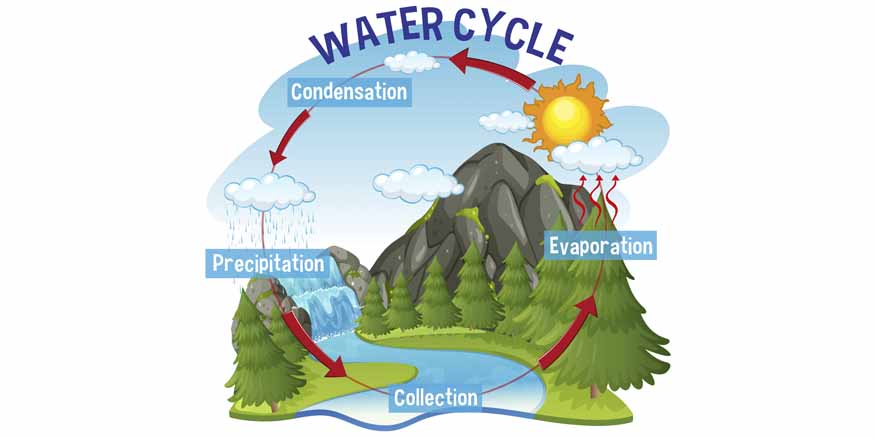
A structured water cycle lesson provides the foundational mechanics necessary for students to understand global hydrology, climate systems, and environmental science. According to the National Science Teaching Association, hands-on visual diagrams combined with inquiry-based observation increase student concept retention by over forty percent compared to traditional textbook reading alone. Mastering hydrological concepts requires systematic engagement with evaporation, condensation, precipitation, and collection phases. The water cycle lesson acts as a comprehensive pedagogical tool that transforms abstract atmospheric phenomena into tangible, observable scientific inquiry for learners across multiple grade levels.
Quick Key Takeaways:
- Core Focus: Comprehensive mapping of evaporation, condensation, precipitation, and collection stages.
- Target User: Primary and middle school educators, science instructors, and homeschooling parents.
- Key Recommendation: Combine visual diagrams with tactile labeling exercises to reinforce spatial memory.
What This Printable Covers
This structured resource addresses the essential Earth science standards governing global hydrological systems, atmospheric temperature shifts, and matter state changes. By integrating foundational geology and meteorology, the material bridges the gap between theoretical definitions and real-world environmental patterns. Students engage directly with terminology such as transpiration, runoff, and percolation through carefully designed graphic organizers and labeling activities found across standard Academic coursework.
Key Learning Outcomes
Learners successfully identify and differentiate the four primary stages of atmospheric water movement while explaining how thermal energy drives phase changes. Participants accurately trace liquid and gas states through geographical landforms, oceans, and the atmosphere. Additionally, the exercises foster critical thinking regarding human impacts on natural water purity and global distribution, supporting broader Personal Growth in environmental stewardship.
Overview & Skill Breakdown
| Focus Area | Target Skill | Best Practice |
|---|---|---|
| Atmospheric Phase | Identifying evaporation and condensation | Pair diagrams with local weather tracking. |
| Terrestrial Movement | Tracing precipitation and runoff | Utilize color-coded arrows for directional flow. |
| Scientific Literacy | Defining core hydrological vocabulary | Incorporate context clues from related Worksheet sets. |
How to Use This Worksheet
Implementation of this resource functions effectively within traditional science classrooms, independent study centers, and homeschooling environments. Instructors can distribute the pages as pre-assessment diagnostics, guided classroom instructional aids, or summative evaluation tools following hands-on evaporation experiments. Organizing students into collaborative pairs allows for peer discussion regarding phase transitions before independent completion of the printed diagrams.
Practical Tips for Success
Preparation involves reviewing baseline terminology with learners to ensure readiness for complex process mapping. During execution, encourage students to trace the cyclical pathways with colored pencils to physically distinguish between heating and cooling stages. For effective extension, connect the printed exercises to real-time meteorological phenomena, such as local rainfall patterns or cloud formations observed outside the classroom window.
Stage-Appropriate Recommendations
Beginner stages focus on basic vocabulary recognition and simple color-by-number diagrams that introduce the four major phases to young children, heavily aligning with Early Learning methodologies. Advanced tiers transition into analytical process mapping, requiring students to explain molecular kinetic energy changes and subterranean aquifer replenishment. According to the National Research Council framework for K-12 science education, progressive scaffolding from macro-level observation to micro-level particulate analysis ensures deep, durable conceptual comprehension.
Visual diagrams combined with inquiry-based observation increase student concept retention by over forty percent. — National Science Teaching Association
Frequently Asked Questions
Explore More Free Printable Resources
Discover an extensive collection of structured educational materials, organizational templates, and subject-specific learning guides designed to support diverse teaching environments. Whether managing classroom schedules or enhancing core academic curricula, Free Printable For You provides high-quality tools for every educational need, including specialized Administrative forms to streamline planning.
Images References